Cape Paterson Property Market Summary: April 2025
Based on the comprehensive sales data for Cape Paterson (postcode 3995) over the past 6 months, the local property market is showing clear signs of price correction. This analysis examines recent trends and offers projections to help current sellers make informed decisions.
Current Market Conditions (October 2024 - April 2025)
The Cape Paterson market has experienced a consistent downward trend in prices over the last 6 months, with the following key indicators:
- Average price reduction from list to sale: -5.2%
- Median sale price: $655,000
- Average days on market: 116 days (with some properties taking up to 387 days to sell)
- Properties selling above asking price: 0%
List Price vs. Sale Price Analysis
Nearly every property (26 out of 30) that sold in this period experienced some form of price reduction. The most severe price drops reached:
- -35.3% (3 Seadragon St)
- -29.9% (127 Seaward Dr)
Even premium properties saw significant reductions:
- 9 Wheeler Rd: Listed via EOI, sold for $1,670,000 (-7.2%)
- 4 Seastar St: Initial price $1,350,000, sold for $1,290,000 (-4.4%)
- 48 Anchor Pde: Initial price $950,000, sold for $725,000 (-23.7%)
Recent Sales Trends (Jan-Apr 2025)
More recent data shows the downward trend accelerating:
- 6 Spray St: Listed at $660,000, sold for $628,000 (-4.8%) after just 25 days
- 33 Spray St: Listed at $690,000, sold for $660,000 (-4.3%) after 21 days
- 114 Anglers Rd: Initially listed at $749,000, ultimately sold for $560,000 (-25.2%) after 260 days
Properties priced accurately from the outset are selling more quickly (typically under 30 days), while overpriced properties face extended market periods averaging 3-4 months and ultimately sell for significantly less than their initial asking prices.
Market Projections for Next 12 Months
Based on current trends, the Cape Paterson market is expected to continue its correction phase:
- Further price softening of 5-10% likely over the next 12 months
- Extended selling periods for properties not priced competitively
- Increased buyer negotiating power as inventory levels remain steady
- Greater price sensitivity in the mid-range market ($600K-$900K)
- Premium properties (over $1M) facing the largest percentage drops
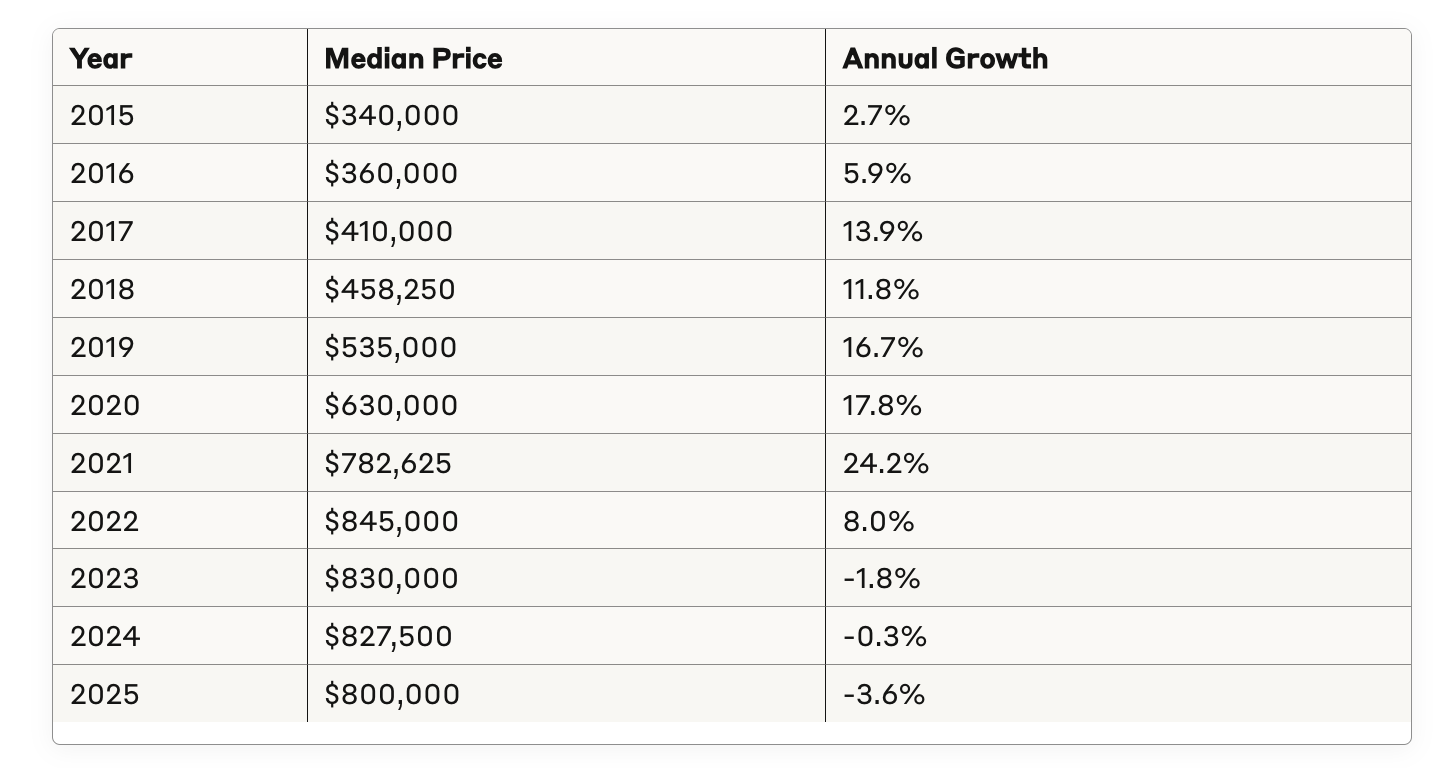
Cape Paterson's Growth Story: A Decade in Review
To fully comprehend the current correction, we need to examine Cape Paterson's remarkable growth journey:
This data reveals an extraordinary growth period from 2017-2021, where Cape Paterson experienced cumulative growth of approximately 90% over just five years. The current correction represents a minor adjustment in the context of this exceptional growth trajectory.
Comparative Coastal Market Analysis
When compared to other Victorian beach towns within two hours of Melbourne, Cape Paterson displays several distinctive characteristics:
When compared to other Victorian beach towns within two hours of Melbourne, Cape Paterson displays several distinctive characteristics:
- Later Boom Adoption:
Cape Paterson's growth phase lagged behind established markets like Torquay by approximately 12-18 months
- Correction Severity:
The current 3.6% decline is moderate compared to some premium coastal markets experiencing deeper corrections
- Price Point Advantage:
Despite recent growth, Cape Paterson remains more affordable than comparable coastal towns like Inverloch, Torquay, and Ocean Grove
Pricefinder data suggests Cape Paterson experienced a less pronounced correction compared to premium markets like Flinders (estimated 8-12% decline), but a more significant adjustment than established markets like Ocean Grove and Barwon Heads (estimated 2-4% decline).
Rental Market Insights
An interesting counterpoint to the sales market correction is the relative strength of Cape Paterson's rental market:
- Current median weekly rent: $470
- Rental yield: +3.1%
- Number of rentals (past 12 months): 29
This positive rental yield growth suggests investor interest remains relatively strong despite the sales market correction. With median weekly rents ranging from $400 to $700 depending on property quality and location, the rental market provides a buffer for investors concerned about short-term capital growth. The higher-end rental properties commanding $600+ weekly (such as 10 Stargazer Avenue and 42 Surf Beach Road) demonstrate continued demand for quality accommodation in the area.
Price Range Analysis: Where is the Market Activity?
The most active price segments in Cape Paterson over the past 12 months have been:
- $800,000-$1 million bracket (6 sales)
- $600,000-$700,000 bracket (5 sales each)
- $700,000-$800,000 bracket (5 sales)
Notably, the luxury segment above $1.2 million has shown continued activity with multiple sales, while the entry-level market below $500,000 has significantly contracted. This suggests that while the market is correcting, it's not experiencing a fundamental reset to pre-boom values.
Days on Market: A Key Indicator
Analysis of the recent sales data reveals increasing days on market for many properties:
- High-demand properties: Premium locations like 1 Heath St (37 days) and 33 Spray St (21 days) continue to sell relatively quickly
- Extended marketing periods: Properties like 114 Anglers Rd (260 days) and 48 Anchor Pde (301 days) demonstrate the market's increased selectivity
This extended time-to-sell indicates a shift to a buyer's market where careful pricing and presentation are becoming increasingly critical factors in achieving timely sales.
Investment Outlook: Navigating the Correction
For investors considering Cape Paterson in 2025, several strategic considerations emerge:
- Counter-cyclical opportunity: The current correction presents a potential entry point following five years of exceptional growth
- Eco-premium advantage: Properties with sustainability features continue to command significant premiums and demonstrate greater price resilience
- Yield focus: With rental yields improving to 3.1%, the investment case remains viable despite slowing capital growth
- Long-term fundamentals: Cape Paterson's coastal location, proximity to Melbourne (under 2 hours), and environmental credentials support its long-term value proposition
The recent data suggests Cape Paterson is experiencing a measured correction rather than a fundamental market reset. The pace of development in The Cape eco-village and continued infrastructure improvements will likely be key determinants of how quickly the market stabilises and returns to growth.
Conclusion: Strategic Positioning for 2025-2026
Cape Paterson's market correction should be viewed in context – following cumulative growth of approximately 150% since 2015, the current 3.6% decline represents a minor adjustment in a longer-term growth trajectory.
For homeowners, this suggests holding through the correction remains a viable strategy, particularly given the continued strength of rental returns for those able to temporarily transition to landlord status.
For prospective buyers, the current environment offers improved negotiating position and reduced competition, particularly in the traditional Cape Paterson market segments away from the premium eco-village properties.
The data clearly indicates Cape Paterson has transitioned from the exponential growth phase of 2019-2021 to a period of price discovery and consolidation. However, its fundamental appeal as a coastal lifestyle destination with unique environmental credentials suggests this correction is likely temporary rather than structural.
As we look ahead to late 2025 and 2026, market participants should focus on the area's long-term value proposition while navigating the short-term price adjustment with strategic patience.
Leo Edwards is an award-winning real estate agent specializing in the Inverloch property market. With access to comprehensive market data and deep local knowledge, Leo provides unparalleled expertise to buyers and sellers navigating this dynamic coastal market. For personalised advice on your property journey, contact Leo today.